With some Americans clamoring to “open up America” and others prepared to hunker down for the foreseeable future, the question of when to start lifting lockdown measures is on everyone’s mind. We appear to be at the peak of this wave of the pandemic, and how we proceed from this point on will determine if and when another wave will hit.
Experts agree that before the social distancing and lockdown measures can safely begin to be lifted, infection numbers have to get low enough and testing and contact tracing have to be systematized enough that we’d be able to contain sporadic outbreaks before they spread. But the U.S. is a huge country. What does that timeline look like in different areas?
One of the unfortunate hallmarks of pandemic is that nothing is totally predictable or certain. Scientists constantly have to ascertain what data they need and and then synthesize the data they have in order to guide decision-makers and give the public information. That means what we know changes frequently, which can be frustrating when we all want to know things for sure.
But changing data doesn’t mean scientists don’t know anything. The phrase “models are always wrong, but some are useful” is tossed around in the scientific community for a reason. Models give us the most likely scenarios based on a snapshot of the variables at any given time. As the variables change, so do the models. That’s why they’re always giving us new numbers.
The University of Washington has been at the forefront of pandemic data since the virus arrived in the U.S., with the first cases being found in Washington State. The university’s Institute for Health Metrics and Evaluation (IHME) dedicated a portion of its website to COVID-19 metrics, which is constantly being updated.
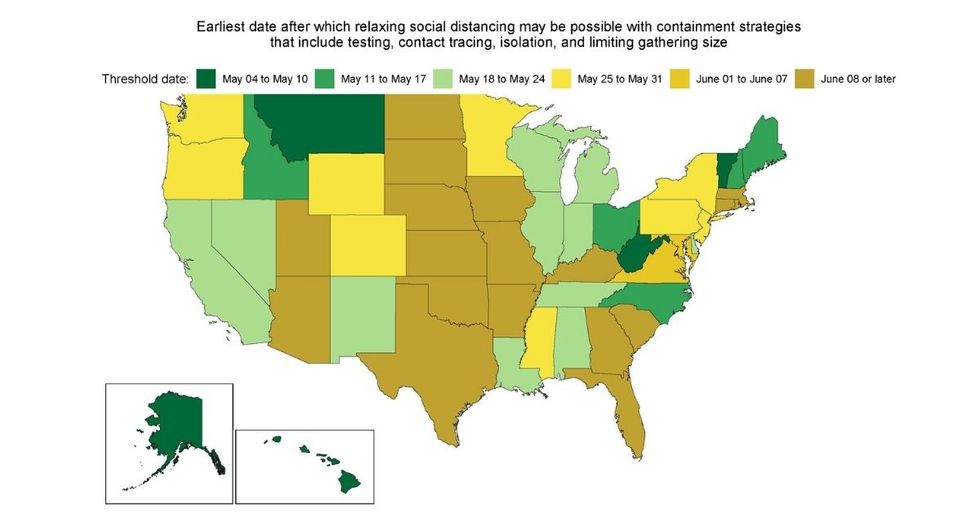
Yesterday, the IHME released a new map showing when, based on the current data, each state might safely be able to start lifting containment measures.
A few things worth noting:
The site states that these are (emphasis mine) “the earliest dates after which relaxing social distancing may be possible with containment strategies that include testing, contact tracing, isolation, and limiting gathering size.” In other words, this doesn’t mean the dates when it’s okay to return back to normal. And the containment strategies (testing, contact tracing) do have to be in place first. But this does at least give us an idea of when it’s reasonable to start easing up a bit.
The earliest date range, which applies to just three states—Montana, West Virginia, and Vermont—is May 4 to May 10. The state of Georgia, which is already lifting lockdown measures, falls well into the latest date range, with a specific date of June 22—a full two months from now.
All of the models that are showing the steep drop in cases and deaths down to near zero are predicated on people maintaining the mitigation measures that have been put in place. Lifting them too soon is one of the variables that can throw the entire thing off.
It is interesting to note that several of the states that fall into the latest date range are states that have not had a great deal of cases. The reason for that is because it’s not the total number of cases that determines the trajectory, but rather the growth curve. The easing up dates are determined by when each state’s “peak” is expected. Some states, even though they don’t have a large number of cases, still have cases increasing and have not yet reached their peak, while other states with large numbers have already reached theirs.
To see exactly what your state’s date for relaxing lockdown is, go to this page on the IHME site, click the “United States of America” dropdown box at the top of the page, and choose your state.